How to interpret ECG data for signs of myocardial infarction? Electrocardiography (ECG): basic theory, recording, analysis, identification of pathologies Stages of acute myocardial infarction changes on the ecg.
Myocardial infarction (necrosis of cardiac muscle tissue) can have varying severity, occurring both asymptomatically and with pronounced characteristic pain.
In most cases, this disease at any stage is detected during routine examinations with an electrocardiograph.
This device, which has been used in cardiology for accurate diagnosis for over a hundred years, can provide information about the stage of the disease, its severity, and the location of the damage.
- All information on the site is for informational purposes only and is NOT a guide to action!
- Can give you an ACCURATE DIAGNOSIS only DOCTOR!
- We kindly ask you NOT to self-medicate, but make an appointment with a specialist!
- Health to you and your loved ones!
Description of the technique
An electrocardiograph is a device that is capable of recording electrical impulses. Human organs emit currents of very low voltage, therefore, to recognize them, the device is equipped with an amplifier, as well as a galvanometer that measures this voltage.
The resulting data is sent to a mechanical recording device. Under the influence of currents emitted by the human heart, a cardiogram is constructed, on the basis of which the doctor can make an accurate diagnosis.
The rhythmic functioning of the heart is ensured by a special tissue called the cardiac conduction system. It is a specially innervated degenerated muscle fiber that transmits commands to contract and relax.
Acute transmural myocardial infarction of the inferior wall of the left ventricle, complicated by type II degree AV block
Cells in a healthy heart receive electrical impulses from the conduction system, the muscles contract, and the electrocardiograph records these weak currents.
The device picks up impulses that have passed through the muscle tissue of the heart. Healthy fibers have a known electrical conductivity, while in damaged or dead cells this parameter is significantly different.
The electrocardiogram shows areas from which information is distorted and abnormal, and it is they that carry information about the course of a disease such as a heart attack.
Main ECG signs of myocardial infarction
Diagnosis is based on measuring the electrical conductivity of individual areas of the heart. This parameter is affected not only by the state of muscle fibers, but also by electrolytic metabolism in the body as a whole, which is disrupted in some forms of gastritis or cholecystitis. In this regard, there are often cases when the ECG results make an erroneous diagnosis of the presence of a heart attack.
There are four distinct stages of a heart attack:

Acute transmural anteroseptal myocardial infarction with possible transition to the apex of the heart
In each of these periods, the physical structure of the cell membranes of muscle tissue, as well as their chemical composition, are different, so the electrical potential also differs significantly. ECG interpretation helps to accurately determine the stages of a heart attack and its size.
Most often, the left ventricle is susceptible to infarction, so the type of section of the cardiogram that displays the Q, R and S waves, as well as the S-T interval and the T wave itself is of diagnostic importance.
The teeth characterize the following processes:
Electrodes are fixed on various parts of the body, which correspond to the projection of certain areas of the heart muscle. For the diagnosis of myocardial infarction, the indicators obtained from six electrodes (leads) V1 – V6 installed on the chest on the left are important.
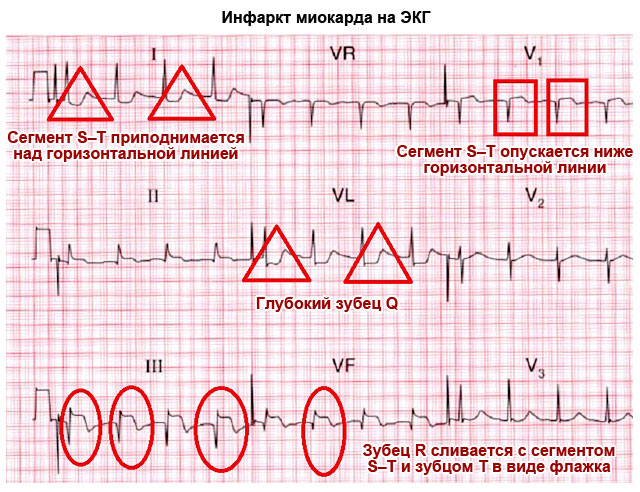
Developing myocardial infarction on the ECG is most clearly manifested by the following signs:
- increase, change, absence or suppression of the R wave over the infarction area;
- pathological S wave;
- change in the direction of the T wave and deviation of the S – T interval from the isoline.
When a necrosis zone forms, the heart muscle cells are destroyed and potassium ions, the main electrolyte, are released.
The electrical conductivity in this area changes sharply, which is reflected in the cardiogram from the lead that is located directly above the necrotic area. The size of the damaged area is indicated by how many leads record the pathology.

Developing large-focal myocardial infarction of the inferior wall of the LV
Indicators of recency and frequency
Diagnosis of an acute infarction occurs in the first 3-7 days, when the active formation of a zone of dead cells, a zone of ischemia and damage occurs. During this period, the electrocardiograph records the maximum affected area, some of which will later degenerate into necrosis, and some will completely recover.
At each stage of a heart attack, it has its own specific diagram pattern from the leads located directly above the heart attack:
| At the acute stage, that is, when the disease is 3–7 days old, the characteristic signs are: |
A change in the directions of the teeth indicates that the walls of the ventricle are greatly hypertrophied, so the electric current in them does not move upward, but inward, towards the interventricular septum. At this stage, with proper treatment, it is possible to minimize the area of damage and the future area of necrosis, and if the area is small, it can be completely restored. |
| The stage of formation of the necrotic area occurs on days 7–10 and has the following characteristic picture: |
At this stage, treatment is aimed at stabilizing the condition and relieving pain, since it is impossible to restore dead areas. The compensatory mechanisms of the heart are activated, which separate the damaged area. The blood washes away the products of death, and the tissues that have undergone necrosis are replaced by connective fibers, that is, a scar is formed. |
| The last stage is characterized by a gradual restoration of the ECG pattern, but characteristic signs remain above the scar: |
This type of cardiogram appears because the connective tissue of the scar is not able to be excited and restored; accordingly, the currents characteristic of these processes are absent in these areas. |

Large-focal anteroseptal-apical-lateral myocardial infarction, complicated by complete block of the right bundle branch, AV block of the first degree and sinus arrhythmia
Determining the location of the circulatory disorder
You can localize the area of damage to the heart muscle by knowing which parts of the organ are visible in each lead. Electrode placement is standard and provides detailed examination of the entire heart.
Depending on which lead records the direct signs described above, the location of the infarction can be determined:
Not all affected areas are shown here, since infarction can occur in both the right ventricle and the posterior parts of the heart. When diagnosing, it is very important to collect as much information as possible from all leads, then the localization will be as accurate as possible. For a confident diagnosis, information must be confirmed by data from at least three leads.
Extensiveness of the outbreak
The extent of the source of damage is determined in the same way as its location. Conventionally, the lead electrodes “shoot” the heart in twelve directions, intersecting in its center.
If the right side is examined, then six more directions can be added to these 12 directions. To make a diagnosis of myocardial infarction, convincing data from at least three sources is required.
When determining the size of the focus of damage, it is necessary to carefully study the data from the leads located in the immediate vicinity of the focus of necrosis. Around the dying tissue there is a zone of damage, and around it there is a zone of ischemia.
Each of these areas has a characteristic ECG pattern, so their detection may indicate the size of the affected area. The true size of the infarction is determined during the healing stage.

Transmural anteroseptal-apical myocardial infarction with transition to the lateral wall of the LV
Depth of necrosis
Various areas may be susceptible to dieback. Necrosis does not always occur throughout the entire thickness of the walls; more often it is deviated towards the inner or outer side, sometimes located in the center.
On the ECG one can confidently note the nature of the location. The S and T waves will change their shape and size depending on which wall the affected area is attached to.
Cardiologists distinguish the following types of necrosis location:
Possible difficulties
Although ECG for myocardial infarction is considered an effective diagnostic method, certain difficulties arise in its use. For example, it is very difficult to correctly diagnose overweight people, since the location of their heart muscle is changed.
If there is a violation of electrolyte metabolism in the body or diseases of the stomach and gallbladder, distortion in the diagnosis is also possible.
Some heart conditions, such as scarring or an aneurysm, make new damage barely noticeable. The physiological features of the structure of the conduction system also make it impossible to accurately diagnose infarctions of the interventricular septum.

Acute large-focal myocardial infarction of the lower wall of the LV with transition to the septum and apex of the heart, the lateral wall of the LV, complicated by atrial fibrillation and right bundle branch block
Type of pathology
Depending on the size and location of the lesion, characteristic patterns are noted on the cardiograph tape. Diagnosis is carried out on days 11–14, that is, at the healing stage.
Large-focal
The following picture is typical for this type of damage:
Subendocardial
If the damage has affected the tissue from the inside, then the diagnostic picture is as follows:
Intramural
For heart attacks located deep in the ventricular wall and not affecting the lining of the heart muscle, the ECG graph is as follows:
This is the last and most difficult part of my ECG cycle. I’ll try to tell you clearly, using as a basis “ Guide to Electrocardiography"V. N. Orlova (2003).
Heart attack(lat. infarcio - stuffing) - necrosis (death) of tissue due to cessation of blood supply. The reasons for stopping blood flow can be different - from blockage (thrombosis, thromboembolism) to a sharp spasm of blood vessels. A heart attack may occur in any organ, for example, there is a cerebral infarction (stroke) or a kidney infarction. In everyday life, the word “heart attack” means exactly “ myocardial infarction", i.e. death of cardiac muscle tissue.
In general, all heart attacks are divided into ischemic(more often) and hemorrhagic. With an ischemic infarction, the flow of blood through the artery stops due to some obstacle, and with a hemorrhagic infarction, the artery bursts (ruptures) with the subsequent release of blood into the surrounding tissues.
Myocardial infarction affects the heart muscle not chaotically, but in certain places. The fact is that the heart receives arterial blood from the aorta through several coronary (coronary) arteries and their branches. If using coronary angiography Find out at what level and in which vessel the blood flow has stopped, you can predict which part of the myocardium is suffering from ischemia(lack of oxygen). And vice versa.
Myocardial infarction occurs when the
blood flow through one or more arteries of the heart.
Coronary angiography is a study of the patency of the coronary arteries of the heart by injecting them with a contrast agent and taking a series of x-rays to assess the speed of spread of the contrast.
Even from school we remember that the heart has 2 ventricles and 2 atria, therefore, logically, they should all be affected by a heart attack with the same probability. Nevertheless, It is the left ventricle that always suffers from a heart attack, because its wall is the thickest, is subjected to enormous loads and requires a large blood supply.
Heart chambers in section.
The walls of the left ventricle are much thicker than the right.
Isolated atrial and right ventricular infarctions- a huge rarity. Most often, they are affected simultaneously with the left ventricle, when ischemia moves from the left ventricle to the right or to the atria. According to pathologists, the spread of infarction from the left ventricle to the right is observed in 10-40% all patients with a heart attack (the transition usually occurs along the posterior wall of the heart). Transition occurs to the atrium in 1-17% cases.
Stages of myocardial necrosis on ECG
Between healthy and dead (necrotic) myocardium, intermediate stages are distinguished in electrocardiography: ischemia And damage.
ECG appearance is normal.
Thus, the stages of myocardial damage during a heart attack are as follows:
- ISCHEMIA: this is the initial damage to the myocardium, in which There are no microscopic changes in the heart muscle yet, but the function is already partially impaired.
As you should remember from the first part of the cycle, two opposing processes sequentially occur on the cell membranes of nerve and muscle cells: depolarization(excitement) and repolarization(restoration of potential difference). Depolarization is a simple process, for which you only need to open ion channels in the cell membrane, through which, due to the difference in concentrations, ions will flow outside and inside the cell. Unlike depolarization, repolarization is an energy-intensive process, which requires energy in the form of ATP. Oxygen is necessary for the synthesis of ATP, therefore, during myocardial ischemia, the repolarization process first begins to suffer. Repolarization disorder is manifested by changes in the T wave.
Variants of T wave changes during ischemia:
a - normal, b - negative symmetrical “coronal” T wave(occurs during a heart attack)
V - tall positive symmetrical “coronal” T wave(for heart attack and a number of other pathologies, see below),
d, e - two-phase T wave,
e - reduced T wave (amplitude less than 1/10-1/8 R wave),
g - smoothed T wave,
h - weakly negative T wave.With myocardial ischemia, the QRS complex and ST segments are normal, but the T wave is changed: it is widened, symmetrical, equilateral, increased in amplitude (span) and has a pointed apex. In this case, the T wave can be either positive or negative - this depends on the location of the ischemic focus in the thickness of the heart wall, as well as on the direction of the selected ECG lead. Ischemia - reversible phenomenon, over time, metabolism (metabolism) is restored to normal or continues to deteriorate with the transition to the damage stage.
- DAMAGE: this deeper defeat myocardium, in which determined under a microscope an increase in the number of vacuoles, swelling and degeneration of muscle fibers, disruption of membrane structure, mitochondrial function, acidosis (acidification of the environment), etc. Both depolarization and repolarization suffer. The injury is thought to primarily affect the ST segment. The ST segment may move above or below the baseline, but its arc (this is important!) when damaged convex in the direction of displacement. Thus, with myocardial damage, the arc of the ST segment is directed towards the displacement, which distinguishes it from many other conditions in which the arc is directed towards the isoline (ventricular hypertrophy, bundle branch block, etc.).
Options for ST segment displacement in case of damage.
T wave when damaged, it can be of different shapes and sizes, which depends on the severity of concomitant ischemia. The damage also cannot exist for long and turns into ischemia or necrosis.
- NECROSIS: myocardial death. Dead myocardium is unable to depolarize, so dead cells cannot form an R wave in the ventricular QRS complex. For this reason, when transmural infarction(death of the myocardium in a certain area along the entire thickness of the heart wall) in this ECG lead of the tooth There is no R at all, and is formed ventricular complex type QS. If necrosis affected only part of the myocardial wall, a complex like QrS, in which the R wave is reduced and the Q wave is increased compared to normal.
Variants of the ventricular QRS complex.
Normal teeth Q and R must obey a number of rules, For example:
- the Q wave should always be present in V4-V6.
- The width of the Q wave should not exceed 0.03 s, and its amplitude should NOT exceed 1/4 of the amplitude of the R wave in this lead.
- prong R should increase in amplitude from V1 to V4(i.e., in each subsequent lead from V1 to V4, the R wave should be raised higher than in the previous one).
- in V1, the r wave may normally be absent, then the ventricular complex has the form QS. In people under 30 years of age, the QS complex can normally occasionally be in V1-V2, and in children - even in V1-V3, although this is always suspicious infarction of the anterior part of the interventricular septum.
What does an ECG look like depending on the area of infarction?
So, to put it simply, necrosis affects the Q wave and for the entire ventricular QRS complex. Damage affects ST segment. Ischemia affects T wave.
The formation of waves on the ECG is normal.
Next, let's look at the drawing I improved from V.N. Orlov's "Manual on Electrocardiography", in which in the center of the conditional wall of the heart there is necrosis zone, along its periphery - damage zone, and outside - ischemic zone. Along the wall of the heart are the positive ends of the electrodes (from No. 1 to 7).
To make it easier to understand, I drew conditional lines that clearly show which ECG zones are recorded in each of the indicated leads:
Schematic view of the ECG depending on the infarction zone.
- Electrode No. 1: located above the transmural infarction area, so the ventricular complex has a QS appearance.
- No. 2: non-transmural infarction (QR) and transmural injury (ST elevation with upward convexity).
- No. 3: transmural injury (ST elevation with upward convexity).
- No. 4: here in the original drawing it is not very clear, but the explanation indicates that the electrode is located above the zone of transmural damage (ST elevation) and transmural ischemia (negative symmetrical “coronal” T wave).
- No. 5: above the zone of transmural ischemia (negative symmetrical “coronary” T wave).
- No. 6: the periphery of the ischemic zone (biphasic T wave, i.e. in the form of a wave. The first phase of the T wave can be either positive or negative. The second phase is opposite to the first).
- No. 7: away from the ischemic zone (reduced or smoothed T wave).
Here is another picture for you to analyze on your own (“Practical electrocardiography”, V.L. Doshchitsin).
Another diagram of the dependence of the type of ECG changes on the infarction zones.
Stages of infarction development on the ECG
The meaning of the stages of development of a heart attack is very simple. When the blood supply completely stops in any part of the myocardium, then in the center of this area the muscle cells die quickly (within several tens of minutes). At the periphery of the lesion, cells do not die immediately. Many cells gradually manage to “recover”; the rest die irreversibly (remember how I wrote above that the phases of ischemia and damage cannot exist for too long?). All these processes are reflected in the stages of development of myocardial infarction. There are four of them: acute, acute, subacute, cicatricial. Below I present the typical dynamics of these stages on the ECG according to Orlov’s guidance.
1) The most acute stage of a heart attack (stage of damage) has an approximate duration from 3 hours to 3 days. Necrosis and its corresponding Q wave may begin to form, but it may not exist. If the Q wave is formed, then the height of the R wave in this lead decreases, often to the point of complete disappearance (QS complex with transmural infarction). The main ECG feature of the most acute stage of myocardial infarction is the formation of the so-called monophasic curve. The monophasic curve consists of ST segment elevation and tall positive T waves, which merge together.
Displacement of the ST segment above the isoline by 4 mm and above in at least one of the 12 regular leads indicates the severity of heart damage.
Note. The most attentive visitors will say that myocardial infarction cannot begin with stages of damage, because between the norm and the damage phase there should be the one described above ischemic phase! Right. But the ischemic phase lasts only 15-30 minutes, so the ambulance usually does not have time to register it on the ECG. However, if this is possible, the ECG shows tall positive symmetrical “coronal” T waves, characteristic of subendocardial ischemia. It is under the endocardium that the most vulnerable part of the myocardium of the heart wall is located, since there is increased pressure in the heart cavity, which interferes with the blood supply to the myocardium (“squeezes” blood out of the heart arteries back).
2) Acute stage lasts up to 2-3 weeks(to make it easier to remember - up to 3 weeks). Areas of ischemia and damage begin to decrease. The zone of necrosis expands, the Q wave also expands and increases in amplitude. If the Q wave does not appear in the acute stage, it is formed in the acute stage (however, there are heart attacks and without Q waves, about them below). ST segment due to limited damage area begins to gradually approach the isoline, A T wave becomes negative symmetrical “coronary” due to the formation of a zone of transmural ischemia around the damaged area.
3) Subacute stage lasts up to 3 months, occasionally longer. The damage zone disappears due to the transition to the ischemic zone (therefore the ST segment comes close to the isoline), the necrosis zone stabilizes(so about true size of infarction judged at this stage). In the first half of the subacute stage, due to the expansion of the ischemic zone, negative the T wave widens and increases in amplitude up to gigantic. In the second half, the ischemia zone gradually disappears, which is accompanied by normalization of the T wave (its amplitude decreases, it tends to become positive). The dynamics of changes in the T wave are especially noticeable on the periphery ischemic zones.
If ST segment elevation does not return to normal after 3 weeks from the moment of heart attack, it is recommended to do echocardiography (EchoCG) to exclude cardiac aneurysms(pouch-like expansion of the wall with slow blood flow).
4) Scar stage myocardial infarction. This is the final stage, in which a durable tissue is formed at the site of necrosis. connective tissue scar. It is not excited and does not contract, therefore it appears on the ECG as a Q wave. Since a scar, like any scar, remains for the rest of life, the scar stage of a heart attack lasts until the last contraction of the heart.
Stages of myocardial infarction.
Which Do ECG changes occur in the scar stage? The scar area (and therefore the Q wave) may, to some extent, decrease due to:
- contractions ( thickening) scar tissue, which brings together intact areas of the myocardium;
- compensatory hypertrophy(increase) adjacent areas of healthy myocardium.
There are no zones of damage and ischemia in the scar stage, therefore the ST segment is on the isoline, and The T wave can be positive, reduced or smoothed. However, in some cases, in the scar stage, it is still recorded small negative T wave, which is associated with constant irritation of adjacent healthy myocardium by scar tissue. In such cases, the amplitude of the T wave should not exceed 5 mm and should not be longer than half of the Q or R wave in the same lead.
To make it easier to remember, the duration of all stages obeys the rule of three and increases incrementally:
- up to 30 minutes (ischemia phase),
- up to 3 days (acute stage),
- up to 3 weeks (acute stage),
- up to 3 months (subacute stage),
- the rest of life (scar stage).
In general, there are other classifications of the stages of infarction.
Differential diagnosis of infarction on ECG
In the third year while studying pathological anatomy and physiology every student of a medical university must learn that all reactions of the body to the same influence in different tissues occur at the microscopic level same type. The sets of these complex sequential reactions are called typical pathological processes. Here are the main ones: inflammation, fever, hypoxia, tumor growth, dystrophy etc. With any necrosis, inflammation develops, resulting in the formation of connective tissue. As I indicated above, the word heart attack comes from lat. infarcio - stuffing, which is caused by the development of inflammation, edema, migration of blood cells into the affected organ and, consequently, its seal. At the microscopic level, inflammation occurs in the same way anywhere in the body. For this reason infarct-like ECG changes there are also for heart injuries and heart tumors(metastases in the heart).
Not every “suspicious” T wave, deviated ST segment or suddenly appearing Q wave is caused by a heart attack.
Normal amplitude T wave ranges from 1/10 to 1/8 of the amplitude of the R wave. A high positive symmetrical “coronary” T wave occurs not only with ischemia, but also with hyperkalemia, increased vagal tone, pericarditis(see ECG below), etc.
(A - normal, B-E - with increasing hyperkalemia).
T waves may also appear abnormal when hormonal imbalances(hyperthyroidism, menopausal myocardial dystrophy) and with changes in the complex QRS(for example, with bundle branch blocks). And these are not all the reasons.
Features of the ST segment and T wave
for various pathological conditions.
ST segment Maybe rise above the isoline not only with myocardial damage or infarction, but also with:
- heart aneurysm,
- PE (pulmonary embolism),
- Prinzmetal's angina,
- acute pancreatitis,
- pericarditis,
- coronary angiography,
- secondary - with bundle branch block, ventricular hypertrophy, early ventricular repolarization syndrome, etc.
ECG option for pulmonary embolism: McGean-White syndrome
(deep S wave in lead I, deep Q and negative T wave in lead III).
ST segment depression cause not only a heart attack or myocardial damage, but also other reasons:
- myocarditis, toxic myocardial damage,
- taking cardiac glycosides, aminazine,
- post-tachycardia syndrome,
- hypokalemia,
- reflex causes - acute pancreatitis, cholecystitis, stomach ulcer, hiatal hernia, etc.,
- shock, severe anemia, acute respiratory failure,
- acute cerebrovascular accidents,
- epilepsy, psychosis, tumors and inflammation in the brain,
- hunger or overeating
- carbon monoxide poisoning,
- secondary - with bundle branch block, ventricular hypertrophy, etc.
Q wave most specific for myocardial infarction, but it can also temporarily appear and disappear in the following cases:
- cerebral infarctions (especially subarachnoid hemorrhages),
- acute pancreatitis,
- coronary angiography,
- uremia (end stage of acute and chronic renal failure),
- hyperkalemia,
- myocarditis, etc.
As I noted above, there are heart attacks without Q waves on the ECG. For example:
- in case subendocardial infarction when a thin layer of myocardium dies near the endocardium of the left ventricle. Due to the rapid passage of excitation in this zone the Q wave does not have time to form. On ECG R wave height decreases(due to loss of excitation of part of the myocardium) and the ST segment descends below the isoline with convexity downwards.
- intramural infarction myocardium (inside the wall) - it is located in the thickness of the myocardial wall and does not reach the endocardium or epicardium. Excitation bypasses the infarction zone on both sides, and therefore the Q wave is absent. But around the infarction zone a transmural ischemia, which manifests itself on the ECG as a negative symmetrical “coronary” T wave. Thus, intramural myocardial infarction can be diagnosed by the appearance negative symmetrical T wave.
You also need to remember that ECG is just one of the research methods when establishing a diagnosis, although a very important method. In rare cases (with atypical localization of the necrosis zone), myocardial infarction is possible even with a normal ECG! I’ll dwell on this a little further.
How do ECGs distinguish heart attacks from other pathologies?
By 2 main features.
1) characteristic ECG dynamics. If the ECG shows changes in the shape, size and location of teeth and segments typical of a heart attack over time, we can speak with a high degree of confidence about a myocardial infarction. In heart attack departments of hospitals ECG is done daily. To make it easier to assess the dynamics of a heart attack on an ECG (which is the most expressed on the periphery of the affected area), it is recommended to apply markings for placement of chest electrodes so that subsequent hospital ECGs are taken in the chest leads completely identically.
An important conclusion follows from this: if pathological changes were detected in a patient’s cardiogram in the past, It is recommended to have a “control” copy of the ECG at home so that the emergency doctor can compare the new ECG with the old one and draw a conclusion about the age of the detected changes. If the patient has previously suffered a myocardial infarction, this recommendation becomes iron rule. Every patient who has had a heart attack should receive a follow-up ECG upon discharge and keep it where they live. And on long trips, take it with you.
2) presence of reciprocity. Reciprocal changes are “mirror” (relative to the isoline) ECG changes on the opposite wall left ventricle. Here it is important to consider the direction of the electrode on the ECG. The center of the heart (the middle of the interventricular septum) is taken as the “zero” of the electrode, so one wall of the heart cavity lies in the positive direction, and the opposite wall lies in the negative direction.
The principle is this:
- for the Q wave the reciprocal change will be R wave enlargement, and vice versa.
- if the ST segment moves above the isoline, then the reciprocal change will be ST offset below isoline, and vice versa.
- for a high positive "coronal" T wave, the reciprocal change would be negative T wave, and vice versa.
.
Direct signs are visible in leads II, III and aVF, reciprocal- in V1-V4.
Reciprocal changes on the ECG in some situations they are the only ones, which can be used to suspect a heart attack. For example, with posterobasal (posterior) infarction myocardium, direct signs of infarction can be recorded only in the lead D (dorsalis) across the Sky[reads e] and in additional chest leads V7-V9, which are not included in the standard 12 and are performed only on demand.
Additional chest leads V7-V9.
Concordance ECG elements - unidirectionality in relation to the isoline of the same ECG waves in different leads (that is, the ST segment and the T wave are directed in the same direction in the same lead). It happens with pericarditis.
The opposite concept is discordance(multi-directional). Typically, this implies discordance of the ST segment and T wave in relation to the R wave (ST is deviated in one direction, T in the other). Characteristic of complete blockades of the His bundle.
ECG at the onset of acute pericarditis:
there is no Q wave and reciprocal changes, characteristic
concordant changes in the ST segment and T wave.
It is much more difficult to determine the presence of a heart attack if there is intraventricular conduction disorder(bundle branch block), which in itself changes a significant part of the ECG beyond recognition from the ventricular QRS complex to the T wave.
Types of heart attacks
A couple of decades ago they divided transmural infarctions(ventricular complex type QS) and non-transmural large-focal infarctions(QR type), but it soon became clear that this does not give anything in terms of prognosis and possible complications. For this reason, heart attacks are currently simply divided into Q-infarctions(Q-wave myocardial infarctions) and non-Q heart attacks(myocardial infarction without Q wave).
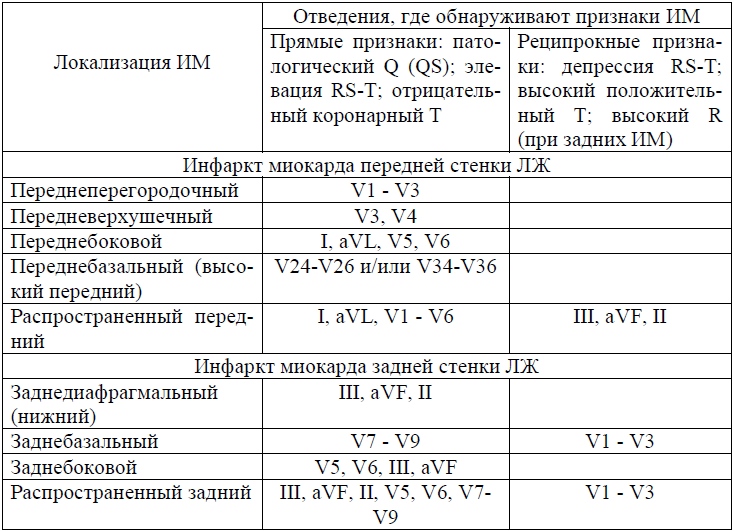
Localization of myocardial infarction
The ECG report must indicate infarction zone(for example: anterolateral, posterior, inferior). To do this, you need to know in which leads ECG signs of different locations of infarction appear.
Here are a couple of ready-made schemes:
Diagnosis of myocardial infarction by location.
Topical diagnosis of myocardial infarction
(elevation- rise, from English. elevation; depression- reduction, from English. depression)
Finally
If you did not understand anything from what was written, do not be upset. Myocardial infarction and, in general, ECG changes in coronary artery disease - the most difficult topic in electrocardiography for students medical university At the Faculty of Medicine, ECG begins to be studied from the third year of study. propaedeutics of internal diseases and study for another 3 years before receiving a diploma, but few graduates can boast of stable knowledge on this topic. I had a friend who (as it turned out later) after the fifth year was specially assigned to a subordination in the obstetrics and gynecology department in order to have fewer encounters with ECG tapes that were difficult for her to understand.
If you want to more or less understand ECG, you will have to spend many tens of hours of thoughtful reading teaching aids and view hundreds of ECG tapes. And when you can draw an ECG from memory of any heart attack or rhythm disorder, congratulate yourself - you are close to the goal.
To establish a diagnosis of myocardial infarction, special equipment is used - an electrocardiograph (ECG). The method by which the fact of this disease is established is quite simple and informative. It should be noted that in medicine, portable versions of this equipment are also used, which make it possible to recognize damage to the patient’s heart muscle at home to monitor the health of their loved ones, even without the involvement of a certified specialist. Medical institutions use multi-channel electrocardiographic equipment, which itself deciphers the received data.
Myocardial infarction type 2 – spasms and dysfunction of the circulatory system
Features of the blood supply to the myocardium
 An electrocardiogram or ECG shows a heart attack, which can happen for a variety of reasons.
 First of all, I would like to note the mechanics of blood flow. The myocardium is supplied with blood from the arteries, which begin from the expanding initial part of the aorta, called the bulb. They are filled with blood in the diastole phase, and in another phase - systole - the blood flow ends by covering the aortic valves, which come into action under the contraction of the myocardium itself.
From the left coronary (coronary) artery there are 2 branches that go through a common trunk to the left atrium. They are called the anterior descending and circumflex branches. These branches supply the following parts of the heart:
- left ventricle: posterior and anterolateral parts;
- left atrium;
- from the right ventricle partially the anterior wall;
- 2/3 of the interventricular septum;
- AV node.
The right coronary artery (RC) originates from the same place as the left one. Then it goes along the coronary groove, passing it and going around the right ventricle (RV), passes to the posterior cardiac wall and feeds the posterior interventricular groove.
The blood flowing through this artery allows the following areas to function:
- right atrium;
- posterior wall of the pancreas;
- part of the left ventricle;
- 1/3 of the interventricular septum (IVS).
Diagonal “highways” of blood depart from the right VA, which feed parts of the heart:
- anterior wall of the left ventricle;
- 2/3 MZhP;
- left atrium (LA).
In half of the cases, another diagonal branch departs from the coronary artery, and in the other half, a median branch.
There are several types of coronary blood supply:
- In 85 percent of cases, the posterior wall is supplied from the right coronary artery.
- 7-8% - from the left coronary artery.
- Uniform blood supply from the right and left coronary arteries.
When correctly “reading” a cardiogram obtained during a myocardial infarction, you need to discern all the signs, understand the processes taking place in the heart, and accurately interpret them. There are two types of signs of a heart attack: direct and reciprocal.
Direct signs include those recorded by an electrode. Reverse signs (reciprocal) are the opposite of direct signs and record necrosis of the reverse cardiac wall. When analyzing a patient's electrocardiogram, it is important to know what a pathological Q wave and pathological ST segment elevation are.
The Q wave is called pathological in the following conditions:
- Present in leads V1-V.
- In chest leads V4-V6 is 25 percent higher than the height of R.
- In I and II it is 15% higher than R.
- In III the excess of R is 60%.
- In all V leads, the segment is 1 mm higher from the isoline, except for the chest lead.
- In chest leads 1-3, the segment is exceeded by 2.5 mm from the isoline, and in leads 4-6 by a height of more than 1 mm.
To prevent the expansion of the area of necrosis, timely and constant diagnosis of myocardial infarction is necessary.
 The table shows what the list of data on the work of the heart muscle looks like and a description of the stage of necrosis for them
 Myocardial infarction on ECG: interpretation
 The photo shows an ECG for myocardial infarction
 To decipher the data obtained by the cardiograph, you need to know certain nuances. On the recorded sheet of paper, segments with and without teeth are clearly visible. They are designated by Latin letters, which are responsible for the data taken from one of the sections of the heart muscle. These waves are ECG indicators and criteria for myocardial infarction.
- Q – shows irritation of ventricular tissues;
- R – apex of the heart muscle;
- S – allows you to analyze the degree of irritation of the walls of the interventricular septum. Vector S is directed inversely to vector R;
- T – “rest” of the ventricles of the heart muscle;
- ST – time (segment) of “rest”.
To obtain data from different parts of the heart muscle, as a rule, 12 electrodes are used. To register a heart attack, electrodes installed on the left side of the chest (fixed to leads V1-V6) are considered significant.
When “reading” the resulting diagram, doctors use a technique for calculating the length between vibrations. Having received the data, you can analyze the rhythm of the heartbeat, with the teeth indicating the force with which the heart contracts. To determine violations, you need to use the following algorithm:
- Analyze data on the rhythm and contractions of the heart muscle.
- Calculate the length between vibrations.
- Calculate the electrical axis of the heart.
- Study the complex of indications under the values of Q, R, S.
- Carry out an analysis of the ST segment.
Attention! If an attack of myocardial infarction without ST-segment elevation occurred, the cause could be ruptures of the formed fatty plaque in the blood vessel. This leads to active blood clotting with the formation of a blood clot.
Signs of myocardial infarction on ECG
Myocardial infarction has manifestations of varying degrees of complexity. There are 4 types (stages) of myocardial infarction, which can be traced on the patient’s cardiogram.
The most acute stage
 Manifestations of the onset of necrosis can be understood by chest pain
 The first stage can last up to three days, being the most acute in the entire course of the disease. In the initial stages of the first stage of myocardial infarction, necrosis is formed - a damaged area, which can be of two types: transmural and intramural myocardial infarction. The ECG during this period contains the following changes in heart function readings:
- The ST segment is elevated, forms a convex arc - elevation.
- The ST segment coincides with the positive T wave - monophase.
- Depending on the severity of necrosis, the R wave will decrease in height.
And reciprocal changes, accordingly, consist in an increase in the R wave.
Acute stage
 Varieties of stages of heart attack: from the second, longer stages of the disease begin
 After this comes the second stage, which can last 2-3 weeks. The focus of necrosis decreases. At this time, ECG signs of myocardial infarction and ischemia appear due to dead cardiomyocytes during the acute period of myocardial infarction. The following readings from electronic sensors are noted on the ECG during the acute period:
- The ST segment is closer to the isoline compared to the data obtained in the first stage, but it is still above it.
- QS and QR pathologies are formed with trans- and non-transmural damage to the heart muscle, respectively.
- A negative symmetrical T wave is formed.
Reciprocal changes are opposite: the T wave increases in height, and the ST segment rises to the isoline.
Subacute stage of myocardial infarction
The duration of the third stage in sequence is even longer - up to 7-8 weeks. At this time, the disease begins to stabilize, necrosis is observed in its true size. In this period, the indications of a heart attack on the ECG are as follows:
- The ST segment is aligned with the contour line.
- QR and QS pathologies persist.
- The T wave begins to deepen.
Scarring
The last stage of myocardial infarction, starting at 5 weeks. The stage received this name because a scar begins to form at the site of necrosis. This scarred area has no electrical or physiological activity. Signs of scarring are displayed on the ECG by the following signs:
- Pathological Q wave present. It is worth remembering that with trans- and non-transmural ailments, pathologies of the QS and QR complexes are observed, respectively.
- The ST segment is aligned with the contour line.
- The T wave is positive, reduced or flattened.
During this period, the pathological waves may completely disappear and the ECG will not be able to detect the infarction that has occurred.
How to recognize the exact location of necrosis
 Localization will be shown by ECG
 To identify the location of necrosis (myocardial infarction) on an ECG, it is not necessary to conduct additional examinations. A cardiogram for a heart attack will be able to provide sufficient information to identify the suspected area. In this case, the cardiogram of the heart will be slightly different.
The following factors also influence the readings of electrical equipment:
- time of onset of the disease;
- depth of lesion;
- reversibility of necrosis;
- localization of myocardial infarction;
- associated disorders.
Classifying a heart attack by location, we can distinguish the following possible cases of the disease:
- anterior wall infarction;
- back wall;
- septal;
- side;
- basal.
Defining and classifying the affected area helps to assess the complexity and identify complications of the disease. For example, if the lesion affects the upper part of the heart muscle, it will not spread, since it is isolated. Damage to the right ventricle is very rare and also has its own characteristics in treatment.
For example, an anteroseptal infarction on an ECG looks like this:
- Pointed T waves in leads 3-4.
- Q – 1-3.
- The ST segment has a rise in segments 1-3.
WHO classification of myocardial infarction
 The methods and duration of treatment depend on the degree of complexity of the disease.
 To classify myocardial infarction, the WHO classification is used. What distinguishes these standards is that they are used only for the classification of large-focal injuries, therefore, according to these standards, mild forms of the disease are not considered.
According to this classification, the following types of damage are distinguished:
- Spontaneous. Occurs due to the destruction of cholesterol plaque and tissue erosion.
- Secondary. Oxygen deficiency caused by blockage of a blood vessel by a thrombus or spasm.
- Sudden coronary death. With this heart attack, a complete disruption of the contractility of the heart occurs with its arrest.
- Percutaneous coronary intervention. The cause is surgical intervention leading to damage to blood vessels or the heart muscle.
- Stent thrombosis.
- Complication of aortic bypass surgery.
Using this qualification, it is possible to determine the degree of necrosis and the causes that gave rise to it. As a rule, it is used for complex forms of heart attack, since the lungs can be determined by the timing of the lesion and location.
Classification by term
To identify the complexity of the lesion, it is necessary to correctly determine the timing of the disease. As a rule, this is initially determined from the patient’s medical history, which contains the call card, and after an initial examination. But they only allow you to provide first aid and perform procedures until the diagnosis is fully identified.
Stages of heart attack by duration:
- Premonitory. Pre-infarction state, when symptoms begin to appear. The duration can reach up to a month.
- The sharpest. During this period, the disease progresses with the formation of necrosis. Duration about 2 hours.
- Spicy. Necrosis develops within 10 days, which can occur with complete necrosis of some areas.
- Subacute. Until the fifth week from the onset of the disease. At this stage of the disease, necrotic areas begin to scar.
- The post-infarction period proceeds with the adaptation of the heart muscles to new operating conditions and with the complete formation of a scar. It can last up to six months.
After the rehabilitation period has passed, changes on the ECG disappear, but signs of chronic ischemia remain.
Used for practical purposes in the 70s of the 19th century by the Englishman A. Waller, the device that records the electrical activity of the heart continues to faithfully serve humanity to this day. Of course, over almost 150 years it has undergone numerous changes and improvements, but the principle of its operation, based on recordings of electrical impulses propagating in the heart muscle, remained the same.
Now almost every ambulance team is equipped with a portable, lightweight and mobile electrocardiograph, which allows you to quickly take an ECG, not waste precious minutes, diagnose and quickly transport the patient to the hospital. For large-focal myocardial infarction and other diseases that require emergency measures, minutes count, so an urgently taken electrocardiogram saves more than one life every day.
Deciphering an ECG for a cardiology team doctor is a common thing, and if it indicates the presence of acute cardiovascular pathology, then the team immediately turns on the siren and goes to the hospital, where, bypassing the emergency room, they will deliver the patient to the intensive care unit for emergency care. The diagnosis has already been made using an ECG and no time has been lost.
Patients want to know...
Yes, patients want to know what the strange teeth on the tape left by the recorder mean, so before going to the doctor, patients want to decipher the ECG themselves. However, everything is not so simple and in order to understand the “tricky” record, you need to know what the human “motor” is.
The heart of mammals, which includes humans, consists of 4 chambers: two atria, endowed with auxiliary functions and having relatively thin walls, and two ventricles, which bear the main load. The left and right parts of the heart are also different. Providing blood to the pulmonary circulation is less difficult for the right ventricle than pushing blood into the systemic circulation with the left. Therefore, the left ventricle is more developed, but also suffers more. However, regardless of the difference, both parts of the heart must work evenly and harmoniously.

The heart is heterogeneous in its structure and electrical activity, since contractile elements (myocardium) and non-contractile elements (nerves, vessels, valves, fatty tissue) differ from each other in varying degrees of electrical response.
Typically, patients, especially older ones, worry about whether there are signs of myocardial infarction on the ECG, which is quite understandable. However, to do this you need to learn more about the heart and the cardiogram. And we will try to provide this opportunity by talking about waves, intervals and leads and, of course, about some common heart diseases.
Heart Abilities
We first learn about the specific functions of the heart from school textbooks, so we imagine that the heart has:
- Automatically, caused by the spontaneous generation of impulses, which then cause its excitation;
- Excitability or the ability of the heart to activate under the influence of exciting impulses;
- or the “ability” of the heart to ensure the conduction of impulses from the place of their origin to the contractile structures;
- Contractility, that is, the ability of the heart muscle to contract and relax under the control of impulses;
- Tonicity, in which the heart does not lose its shape in diastole and ensures continuous cyclic activity.
In general, the heart muscle in a calm state (static polarization) is electrically neutral, and biocurrents(electrical processes) are formed in it under the influence of exciting impulses.
Biocurrents in the heart can be recorded
Electrical processes in the heart are caused by the movement of sodium ions (Na+), which are initially located outside the myocardial cell, into it and the movement of potassium ions (K+), rushing from inside the cell to the outside. This movement creates the conditions for changes in transmembrane potentials throughout the entire cardiac cycle and repeated depolarizations(excitation, then contraction) and repolarizations(transition to the original state). All myocardial cells have electrical activity, but slow spontaneous depolarization is characteristic only of the cells of the conduction system, which is why they are capable of automatism.
 Excitement spreading through conducting system, sequentially covers the parts of the heart. Starting in the sinoatrial (sinus) node (the wall of the right atrium), which has maximum automaticity, the impulse passes through the atrial muscles, the atrioventricular node, the bundle of His with its legs and is directed to the ventricles, stimulating parts of the conduction system even before the manifestation of its own automaticity .
Excitation that occurs on the outer surface of the myocardium leaves this part electronegative in relation to areas not touched by excitation. However, due to the fact that body tissues have electrical conductivity, biocurrents are projected onto the surface of the body and can be recorded and recorded on a moving tape in the form of a curve - an electrocardiogram. The ECG consists of waves that are repeated after each heartbeat, and through them shows the disorders that exist in the human heart.
How is an ECG taken?
Many people can probably answer this question. Doing an ECG, if necessary, will also not be difficult - there is an electrocardiograph in every clinic. ECG technique? It only seems at first glance that it is so familiar to everyone, but meanwhile, only medical workers who have undergone special training in taking an electrocardiogram know it. But we hardly need to go into details, since no one will allow us to do such work without preparation anyway.

Patients need to know how to properly prepare: that is, it is advisable not to overeat, not to smoke, not to drink alcoholic beverages and medications, not to get involved in heavy physical labor and not to drink coffee before the procedure, otherwise you can fool the ECG. It will certainly be provided, if nothing else.
So, a completely calm patient undresses to the waist, frees his legs and lies down on the couch, and the nurse will lubricate the necessary places (leads) with a special solution, apply electrodes from which wires of different colors go to the device, and take a cardiogram.
The doctor will decipher it later, but if you are interested, you can try to figure out your teeth and intervals yourself.
Teeth, leads, intervals
This section may not be of interest to everyone, in which case you can skip it, but for those who are trying to understand their ECG on their own, it may be useful.
The waves in the ECG are designated using Latin letters: P, Q, R, S, T, U, where each of them reflects the state of different parts of the heart:
- P – atrial depolarization;
- QRS wave complex – ventricular depolarization;
- T – ventricular repolarization;
- A weak U wave may indicate repolarization of the distal portions of the ventricular conduction system.

To record an ECG, 12 leads are usually used:
- 3 standard – I, II, III;
- 3 reinforced unipolar limb leads (according to Goldberger);
- 6 reinforced unipolar chest (according to Wilson).
In some cases (arrhythmias, abnormal location of the heart), there is a need to use additional unipolar chest and bipolar leads according to Neb (D, A, I).

When interpreting the ECG results, the duration of the intervals between its components is measured. This calculation is necessary to assess the rhythm frequency, where the shape and size of the teeth in different leads will be an indicator of the nature of the rhythm, the electrical phenomena occurring in the heart and (to some extent) the electrical activity of individual sections of the myocardium, that is, the electrocardiogram shows how our heart works at that time. or another period.
Video: lesson on ECG waves, segments and intervals
ECG analysis
A more rigorous interpretation of the ECG is made by analyzing and calculating the area of the teeth when using special leads (vector theory), however, in practice, they mainly make do with such an indicator as electrical axis direction, which is the total QRS vector. It is clear that everyone’s chest is structured differently and the heart does not have such a strict arrangement, the weight ratio of the ventricles and the conductivity inside them are also different for everyone, therefore, when deciphering, the horizontal or vertical direction of this vector is indicated.
Doctors carry out ECG analysis in a sequential order, determining the norm and violations:
- Assess the heart rhythm and measure the heart rate (with a normal ECG - sinus rhythm, heart rate - from 60 to 80 beats per minute);
- Intervals (QT, norm – 390-450 ms) are calculated, characterizing the duration of the contraction phase (systole) using a special formula (I often use Bazett’s formula). If this interval lengthens, then the doctor has the right to suspect. Hypercalcemia, on the contrary, leads to a shortening of the QT interval. The conductivity of the pulses reflected through the intervals is calculated using a computer program, which significantly increases the reliability of the results;
- they begin to calculate from the isoline according to the height of the teeth (normally R is always higher than S) and if S exceeds R and the axis deviates to the right, then they think about disturbances in the activity of the right ventricle, if on the contrary - to the left, and at the same time the height of S is greater than R in II and III leads – left ventricular hypertrophy is suspected;
- The QRS complex is studied, which is formed during the conduction of electrical impulses to the ventricular muscle and determines the activity of the latter (the norm is the absence of a pathological Q wave, the width of the complex is not more than 120 ms). If this interval shifts, then we speak of blockades (full or partial) of the bundle branches or conduction disturbances. Moreover, incomplete blockade of the right bundle branch is an electrocardiographic criterion of right ventricular hypertrophy, and incomplete blockade of the left bundle branch may indicate left ventricular hypertrophy;
- They describe the ST segments, which reflect the period of restoration of the initial state of the heart muscle after its complete depolarization (normally located on the isoline) and the T wave, which characterizes the process of repolarization of both ventricles, which is directed upward, asymmetrical, its amplitude is lower than the wave in duration and is longer than the QRS complex.
The decoding work is carried out only by a doctor, however, some ambulance paramedics perfectly recognize common pathologies, which is very important in emergency cases. But first, you still need to know the ECG norm.

This is what the cardiogram of a healthy person looks like, whose heart works rhythmically and correctly, but not everyone knows what this record means, which can change under various physiological conditions, such as pregnancy. In pregnant women, the heart takes a different position in the chest, so the electrical axis shifts. In addition, depending on the duration, the load on the heart is added. An ECG during pregnancy will reflect these changes.
The cardiogram indicators in children are also excellent; they will “grow” with the baby, and therefore will change according to age; only after 12 years, the child’s electrocardiogram begins to approach the ECG of an adult.
The most disappointing diagnosis: heart attack

The most serious diagnosis on the ECG, of course, is, in the recognition of which the cardiogram plays the main role, because it is she (the first!) that finds areas of necrosis, determines the localization and depth of the lesion, and can distinguish an acute infarction from the scars of the past.
The classic signs of myocardial infarction on the ECG are the registration of a deep Q wave (OS), segment elevationST, which deforms R, smoothing it, and the subsequent appearance of a negative pointed isosceles tooth T. This elevation of the ST segment visually resembles a cat’s back (“cat”). However, a distinction is made between myocardial infarction with and without the Q wave.

Video: signs of a heart attack on an ECG
When there's something wrong with your heart
Often in ECG conclusions you can find the expression: “”. As a rule, such a cardiogram is obtained by people whose hearts have had an additional load for a long time, for example, due to obesity. It is clear that the left ventricle has a hard time in such situations. Then the electrical axis deviates to the left, and S becomes greater than R.

hypertrophy of the left (left) and right (right) ventricles of the heart on the ECG
Video: cardiac hypertrophy on ECG
One of the presenters will answer your question.
The questions in this section are currently answered by: Sazykina Oksana Yurievna, cardiologist, therapist
You can thank a specialist for their help or support the VesselInfo project at any time.
In questions about interpreting the ECG, be sure to indicate the patient’s gender, age, clinical data, diagnoses and complaints.
Myocardial infarction on the ECG has a number of characteristic signs that help differentiate it from other disorders of conduction and excitability of the heart muscle. It is very important to conduct an ECG diagnosis in the first few hours after an attack in order to obtain data on the depth of the lesion, the degree of functional heart failure, and the possible localization of the lesion. Therefore, if possible, the cardiogram is taken while still in the ambulance, and if this is not possible, then immediately upon the patient’s arrival at the hospital.
ECG signs of myocardial infarction
An electrocardiogram reflects the electrical activity of the heart - by interpreting the data from such a study, one can obtain comprehensive information about the functioning of the conduction system of the heart, its ability to contract, pathological foci of excitation, as well as the course of various diseases.
The first sign to look for is deformation of the QRST complex, in particular, a significant reduction in the R wave or its complete absence.
The classic ECG picture consists of several areas that can be seen on any normal tape. Each of them is responsible for a separate process in the heart.
- P wave– visualization of atrial contraction. By its height and shape one can judge the state of the atria, their coordinated work with other parts of the heart.
- PQ interval– shows the spread of the excitation impulse from the atria to the ventricles, from the sinus node down to the atrioventricular node. Prolongation of this interval indicates a conduction disorder.
- QRST complex– ventricular complex, which provides complete information about the state of the most important chambers of the heart, the ventricles. Analysis and description of this part of the ECG is the most important part of diagnosing a heart attack; the main data is obtained from here.
- ST segment- an important part, which is normally an isoline (a straight horizontal line on the main axis of the ECG, without teeth), in pathologies it can fall and rise. This may be evidence of myocardial ischemia, i.e. insufficient blood supply to the heart muscle.
Any changes in the cardiogram and deviations from the norm are associated with pathological processes in the cardiac tissue. In the case of a heart attack - with necrosis, that is, necrosis of myocardial cells with their subsequent replacement with connective tissue. The stronger and deeper the damage, the wider the area of necrosis, the more noticeable the changes on the ECG will be.
The first sign to look for is deformation of the QRST complex, in particular, a significant reduction in the R wave or its complete absence. This indicates a violation of ventricular depolarization (the electrophysical process responsible for heart contraction).
Any changes in the cardiogram and deviations from the norm are associated with pathological processes in the cardiac tissue. In the case of a heart attack - with the necrosis of myocardial cells, followed by their replacement with connective tissue.
Further changes affect the Q wave - it becomes pathologically deep, which indicates a disruption in the functioning of pacemakers - nodes made of special cells in the thickness of the myocardium that begin contraction of the ventricles.
The ST segment also changes - normally it is on the isoline, but during a heart attack it can rise higher or fall lower. In this case, they speak of elevation or depression of the segment, which is a sign of ischemia of the heart tissue. Using this parameter, it is possible to determine the localization of the area of ischemic damage - the segment is raised in those parts of the heart where necrosis is most pronounced, and lowered in the opposite leads.
Also, after some time, especially closer to the scarring stage, a negative deep T wave is observed. This wave reflects massive necrosis of the heart muscle and makes it possible to determine the depth of damage.
An ECG photo for myocardial infarction with interpretation allows you to consider the described signs in detail.

The tape can move at speeds of 50 and 25 mm per second; lower speeds with better detail have greater diagnostic value. When diagnosing a heart attack, not only changes in leads I, II and III are taken into account, but also in the reinforced ones. If the device allows you to record the chest leads, then V1 and V2 will display information from the right parts of the heart - the right ventricle and atrium, as well as the apex, V3 and V4 about the apex of the heart, and V5 and V6 will indicate the pathology of the left parts.
Closer to the scarring stage, a negative deep T wave is observed. This wave reflects massive necrosis of the heart muscle and allows you to determine the depth of damage.
Stages of myocardial infarction on ECG
A heart attack occurs in several stages, and each period is marked by special changes on the ECG.
- Ischemic stage (damage stage, acute) associated with the development of acute circulatory failure in the tissues of the heart. This stage does not last long, so it is rarely recorded on a cardiogram tape, but its diagnostic value is quite high. At the same time, the T wave increases and becomes sharper - they talk about a giant coronary T wave, which is a harbinger of a heart attack. Then ST rises above the isoline; its position here is stable, but further elevation is possible. When this phase lasts longer and becomes acute, a decrease in the T wave can be observed, as the focus of necrosis spreads to the deeper layers of the heart. Reciprocal and reverse changes are possible.
- Acute stage (necrosis stage) occurs 2-3 hours after the onset of the attack and lasts up to several days. On the ECG it looks like a deformed, wide QRS complex, forming a monophasic curve, where it is almost impossible to distinguish individual waves. The deeper the Q wave on the ECG, the deeper layers were affected by ischemia. At this stage, transmural infarction can be recognized, which will be discussed later. Characteristic rhythm disturbances are arrhythmias, extrasystoles.
- Recognize the onset of the subacute stage possible by stabilizing the ST segment. When it returns to the baseline, the infarction no longer progresses due to ischemia, and the recovery process begins. The greatest importance in this period is the comparison of the existing T wave sizes with the original ones. It can be either positive or negative, but will slowly return to the baseline in sync with the healing process. Secondary deepening of the T wave in the subacute stage indicates inflammation around the necrosis zone and does not last long with proper drug therapy.
- In the scarring stage, the R wave rises again to its characteristic values, and T is already on the isoline. In general, the electrical activity of the heart is weakened, because some of the cardiomyocytes have died and been replaced by connective tissue, which does not have the ability to conduct and contract. Pathological Q, if present, is normalized. This stage lasts up to several months, sometimes six months.
It is very important to conduct an ECG diagnosis in the first few hours after an attack in order to obtain data on the depth of the lesion, the degree of functional heart failure, and the possible localization of the lesion.
Main types of heart attack on ECG
In the clinic, a heart attack is classified depending on the size and location of the lesion. This is important in the treatment and prevention of delayed complications.
Depending on the size of the damage, there are:
- Large-focal, or Q-infarction. This means that the circulatory disorder occurred in a large coronary vessel, and a large volume of tissue was affected. The main sign is a deep and widened Q wave, and the R wave cannot be seen. If the infarction is transmural, that is, affecting all layers of the heart, the ST segment is located high above the isoline, in the subacute period a deep T is observed. If the damage is subepicardial, that is, not deep and located next to the outer shell, then R will be recorded, albeit small.
- Small focal, non-Q infarction. Ischemia developed in areas supplied by the terminal branches of the coronary arteries; this type of disease has a more favorable prognosis. With an intramural infarction (the damage does not extend beyond the heart muscle), Q and R do not change, but a negative T wave is present. In this case, the ST segment is on the isoline. In subendocardial infarction (focus near the inner membrane), T is normal and ST is depressed.

Depending on the location, the following types of heart attack are determined:
- Anteroseptal Q-infarction– noticeable changes in 1-4 chest leads, where there is no R in the presence of wide QS, ST elevation. In standard I and II – pathological Q, classic for this type.
- Lateral Q-infarction– identical changes affect chest leads 4-6.
- Posterior or diaphragmatic Q-infarction, also known as inferior– pathological Q and high T in leads II and III, as well as intensified from the right leg.
- Interventricular septal infarction– in standard I, deep Q, ST elevation and high T. In thoracic 1 and 2, R is pathologically high, and A-V block is also characteristic.
- Anterior non-Q infarction– in I and 1-4 thoracic T is higher than the preserved R, and in II and III there is a decrease in all waves along with ST depression.
- Posterior non-Q infarction– in standard II, III and chest 5-6 positive T, decreased R and depression ST.
Video
We offer you to watch a video on the topic of the article.


